Posts

Showing posts with the label ECG

CARDIAC SYNDROME X

Image
CARDIAC SYNDROME X (SCX) or microvascular angina is a typical retrosternal chest pain with ischemia documented on noninvasive test (ST depression and/or perfusion abnormality) in the absence of any significant coronary artery disease . Associated with increased cardiovascular risk. 
PRINZMETAL ANGINA (VASOSPASTIC ANGINA, VARIANT ANGINA)

Image
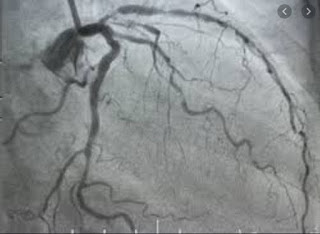
PRINZMETAL ANGINA is severe angina at rest , even asleep with transient ST-segment elevation .  Myron Prinzmetal was an American cardiologist, who was the first to describe this type of angina.   It occurs due to vasospasm, in contrast to stable angina pectoris, which occurs due to atherosclerosis. It is characterized by a deterioration in the patient's condition from midnight to 8:00.

Acute restoration of sinus rhythm.

Image
   

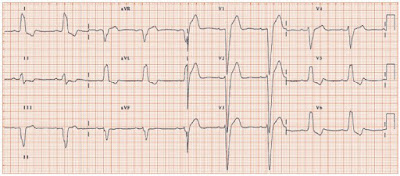
Left Bundle Branch Block (LBBB).

Image
    In left bundle branch block there is a delay or blockage of conduction in the main left bundle  branch. This affects the normal depolarisation in the ventricles.     In left bundle branch block, the impulse begins in the SA node and depolarises the atria, then  travels through the AV node to the left and right bundle branches. On finding the left bundle branch  blocked, the impulse travels down the right bundle branch.

ECG. Right Bundle Branch Block (RBBB)

Image
In case of    Right Bundle Branch Block a ctivation of right  ventricle  is delayed and spreads through the septum from the left side (left ventricle). Blockade location, both in complete and partial blocks, is usually proximal. Main causes: Pulmonary embolism Chronic obstructive lung disease. Ischaemic heart disease (myocardial infarction) Hypertensive heart disease Myocarditis Cardiomyopathy RBBB also can occur in normal individuals without underlying heart disease ECG criteria:

Right Ventricular Hypertrophy.

Image
Right Ventricular Hypertrophy is an increase in the thickness of the walls of the right ventricle. The right ventricle is three times thinner than the left ventricle, thus frequently hypertrophy of the right ventricle may be unrecognized. Causes:

Hyperkalemia: Understanding Levels and ECG Changes

Image
Hyperkalemia: Understanding Levels and ECG Changes Tags : hyperkalemia, ECG changes, potassium levels, medical emergency, cardiac arrhythmias Hyperkalemia, a potentially life-threatening electrolyte imbalance, occurs when serum potassium levels exceed 5.0 mmol/L. For medical professionals, recognizing hyperkalemia levels and their associated ECG changes is critical for timely intervention. This guide breaks down potassium thresholds, clinical implications, and electrocardiographic findings to sharpen your diagnostic skills.

LOCALIZATION OF CULPRIT ARTERY IN STEMI. MNEMONIC

Image

ECG MNEMONIC. THE DIAGONAL RULE.

Image

ECG. Left Ventricular Hypertrophy.

Image
Left ventricular hypertrophy is an increase in the size of the left ventricle. When the wall of  the left ventricle increases in thickness, the heights of the QRS complexes increase. Tall voltage is usually present in Leads I , aVL , V5 and V6 . Tall voltage will be recorded in the form of tall R  waves. Likewise, when the myocardium as abnormally thickened and electrical activity takes longer to traverse throughout the whole heart, thus the duration of the QRS complex may be widened . Also, repolarization may be affected via similar mechanisms which can result in abnormal ST segments or T waves . This is referred to as "LVH with strain" or "LVH with repolarization abnormality".  The typical pattern with left ventricular hyertrophy includes deviation of the ST segment in the opposite direction of the QRS complex (discordance) and a typical T wave inversion pattern is present. ECG Criteria Sokolow-Lyon Criteria : Add the S wave in V1 plus the...

ECG: Left and Right Atrial Enlargement

Image
  Left atrial hypertrophy   An increase in the thickness of the left atrial wall is known as left atrial hypertrophy . This occurs  frequently in left ventricular enlargement, although it can also occur alone. The P wave is often  widened because of the increased time that it takes the impulse to travel over the thickened atrial wall. The P wave is notched, like an M  shape . This is known as P-mitrale. In some  leads (typically V1) the P wave becomes negative. Right atrial hypertrophy   An increase in the thickness of the right atrium is known as right atrial hypertrophy. If the right  atrium is hypertrophied there will be an increase in the height of the P wave (2.5 mm or more).  This is seen most clearly in Lead II, and is due to the increase in the number of impulse directions  travelling directly towards Lead II. The P wave also looks peaked. This is known as   P-pulmonale . The width of the P...

BRIEFLY: THE BASIC ECG FORM & MEASUREMENTS

Image
P wave   - the spread of electrical activation (depolarisation) through the atrial myocardium. QRS complex   - the spread of electrical activation through the ventricular myocardium. T wave   - electrical recovery (repolarisation) of the ventricular myocardium.  U wave   may be due to slow replolarisation of the papillary muscles.  Some causes include: Bradycardia, hypokalaemia and digoxin. Measurements Heart rate :  Rule of 300   - Provided that the  rhythm is regular , heart rate can be estimated by dividing 300 by the number of large boxes in the R-R interval.  i.e. Heart Rate = 300/ no. of large boxes in the R-R interval PR interval : 0.12 - 0.20 s  QRS duration : 0.06 - 0.10 s  Corrected QT interval (QTc) : normal QTc = 0.40 s Bazett's formula:  QTc = QT / RR 1/2  (in seconds)   Determining of Heart Axis.  The fastest, non-specific method to determine the...